In today’s data-driven world, the ability to quickly and effectively visualize data is crucial. Instacharts is a powerful tool that allows users to create charts instantly, making data presentation easier and more dynamic. This article will delve into the features, pricing, and reviews of Instacharts, providing a comprehensive overview of why this tool is worth considering for your data visualization needs.
Why You Should Read This Article:
Understanding how to leverage tools like Instacharts can significantly enhance the way you present and interpret data. Whether you’re a business professional, educator, or data enthusiast, this article will provide valuable insights into how Instacharts can help you create interactive and informative charts effortlessly.
Article Outline
1. What is Instacharts?
2. Key Features of Instacharts
3. How to Create Charts with Instacharts
4. Can You Edit Charts in Instacharts?
5. How to Share Charts Created with Instacharts
6. Pricing Plans: How Much Does Instacharts Cost?
7. Is Instacharts Suitable for Multiple Users?
8. How to Choose the Right Chart Type
9. User Reviews and Feedback
10. Why Instacharts is a Recommended Data Visualization Tool
What is Instacharts?
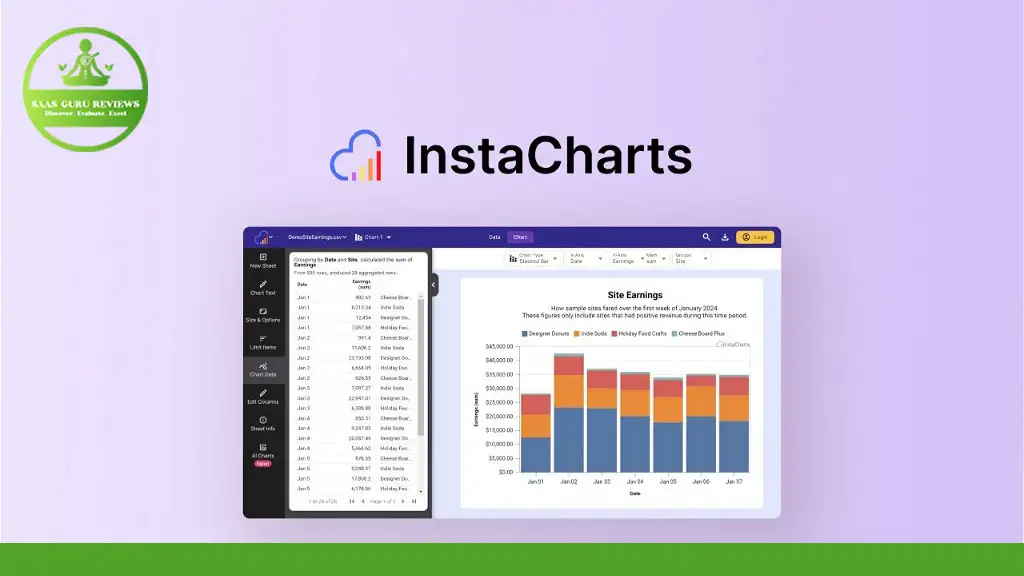
Instacharts is an online chart maker designed to help users create charts instantly. It is particularly useful for those who need to visualize data quickly without the hassle of complex software. With Instacharts, you can upload data from various file formats such as CSV, JSON, and Excel, and instantly create interactive charts that can be shared and embedded across different platforms.
Instacharts recognizes CSV files and other common spreadsheet formats, making it easy to upload a spreadsheet from your device. Once your data is uploaded, you can select from a range of chart types, customize the appearance, and instantly create a chart that suits your needs.
Key Features of Instacharts
Interactive Charts and Data Tables
One of the standout features of Instacharts is its ability to create interactive charts. These charts allow users to hover over data points to get more detailed information, making data exploration more intuitive. Additionally, Instacharts can generate data tables alongside charts, providing a comprehensive view of your data.
Easy Data Upload and Integration
Instacharts supports multiple file formats, including CSV, JSON, and Excel. This flexibility allows users to upload data from various sources and formats seamlessly. The tool also includes options to upload a spreadsheet file directly from your device, ensuring that data integration is as smooth as possible.
Customization and Editing
Instacharts offers various customization options, allowing users to change chart attributes without much hassle. You can easily modify the axis, column names, and formatting to suit your presentation style. The tool also allows you to quickly change chart types and update data points, making it a versatile option for dynamic data visualization.
How to Create Charts with Instacharts
Creating charts with Instacharts is a straightforward process. Here’s a step-by-step guide:
-
Upload Your Data: Start by uploading your data file. Instacharts supports CSV, JSON, and Excel file types. Simply select a spreadsheet file from your device, and the tool will recognize and import your data.
-
Select Chart Type: Once your data is uploaded, you can choose from a variety of chart types, including bar, line, pie, and more. This flexibility allows you to select the chart type that best visualizes your data.
-
Customize Your Chart: After selecting the chart type, you can customize it by changing the axis labels, column names, and other formatting options. Instacharts provides an easy-to-use interface for these adjustments.
-
Create and Save: Once you’re satisfied with the customization, you can create the chart and save it. Instacharts allows you to export the chart as an image or embed it on a webpage.
Can You Edit Charts in Instacharts?
Yes, Instacharts provides robust editing features that allow you to modify your charts even after they have been created. This flexibility is particularly useful for dynamic data sets that may require frequent updates.
Editing Features
Instacharts enables users to change various attributes of their charts, including axis labels, column names, and data points. You can also switch between different chart types if you find that another type better represents your data. This makes Instacharts a versatile tool for ongoing data analysis and presentation.
Real-Time Updates
One of the significant advantages of using Instacharts is the ability to make real-time updates. If your data changes, you can quickly upload the new data set, and the chart will update accordingly. This feature ensures that your charts are always current and accurate.
How to Share Charts Created with Instacharts
Sharing your charts is simple with Instacharts. The tool offers multiple sharing options to ensure your data reaches the intended audience effectively.
Public Links and Embedding
Instacharts allows you to create public links for your charts, making it easy to share them with your team or stakeholders. You can also embed charts on webpages, blogs, or reports, providing a seamless way to integrate interactive charts into your content.
Export Options
In addition to sharing via links and embedding, Instacharts provides export options that allow you to download chart images in various formats, including PNG. This feature is useful for including charts in presentations or documents where online access may not be available.
Pricing Plans: How Much Does Instacharts Cost?
Instacharts offers a range of pricing plans to cater to different user needs. Whether you’re an individual user or part of a large organization, there’s a plan that fits your requirements.
Free Plan
The free plan provides basic features, allowing users to create and share a limited number of charts. This plan is ideal for individuals or small teams who need to visualize data occasionally.
Premium Plans
For users who require more advanced features and higher limits, Instacharts offers premium plans. These plans include additional customization options, higher data upload limits, and priority support. The pricing is competitive, making it a cost-effective solution for businesses and professionals.
Is Instacharts Suitable for Multiple Users?
Yes, Instacharts is designed to accommodate multiple users, making it an excellent choice for teams and organizations.
Team Collaboration
Instacharts supports team collaboration by allowing multiple users to access and edit charts. This feature is particularly useful for projects that require input from various team members. You can share interactive charts with your team through a public link, ensuring everyone stays on the same page.
User Management
The tool also includes user management features, allowing administrators to control access levels and permissions. This ensures that sensitive data remains secure while enabling collaboration.
How to Choose the Right Chart Type
Choosing the right chart type is crucial for effective data visualization. Instacharts offers a variety of chart types, each suited for different kinds of data.
Bar and Column Charts
Bar and column charts are ideal for comparing different categories. They are particularly useful for visualizing discrete data points and making comparisons across groups.
Line and Area Charts
Line and area charts are best suited for showing trends over time. They are commonly used for time-series data, where the focus is on how data points change over a continuous range.
Pie and Donut Charts
Pie and donut charts are excellent for showing proportions and percentages. They are useful for visualizing the composition of a whole and comparing parts of a dataset.
User Reviews and Feedback
User reviews and feedback are essential for understanding the strengths and weaknesses of any tool. Instacharts has received positive reviews for its ease of use, flexibility, and robust features.
Positive Feedback
Many users appreciate the intuitive interface and the ability to create charts quickly. The customization options and real-time updates are also frequently mentioned as significant advantages.
Areas for Improvement
While Instacharts is highly regarded, some users have pointed out areas for improvement, such as the need for more advanced analytical features and better integration with other data tools. However, the development team is continually working on updates to address these concerns.
Why Instacharts is a Recommended Data Visualization Tool
Instacharts stands out as a recommended data visualization tool due to its ease of use, flexibility, and comprehensive features. Whether you need to create simple bar charts or complex interactive charts, Instacharts provides the tools you need to visualize your data effectively.
Key Takeaways
- Ease of Use: Instacharts is user-friendly, making it accessible for users of all skill levels.
- Flexibility: The tool supports multiple file formats and offers a variety of chart types.
- Customization: Extensive customization options allow you to tailor charts to your specific needs.
- Sharing Options: Easily share charts via public links, embedding, or exporting images.
- Affordable Pricing: Competitive pricing plans make Instacharts a cost-effective solution for individuals and organizations.
Summary of Most Important Things to Remember
- Instacharts is an online tool that allows you to create charts instantly.
- It supports multiple file formats, including CSV, JSON, and Excel.
- The tool offers extensive customization and editing features.
- You can share charts via public links, embedding, or exporting images.
- Pricing plans are available to suit different user needs, from free to premium options.
- User reviews highlight the tool’s ease of use and flexibility, with some areas for improvement.
- Instacharts is suitable for multiple users and supports team collaboration.
- Choosing the right chart type is crucial for effective data visualization.
By understanding these key points, you can make an informed decision about whether Instacharts is the right tool for your data visualization needs.